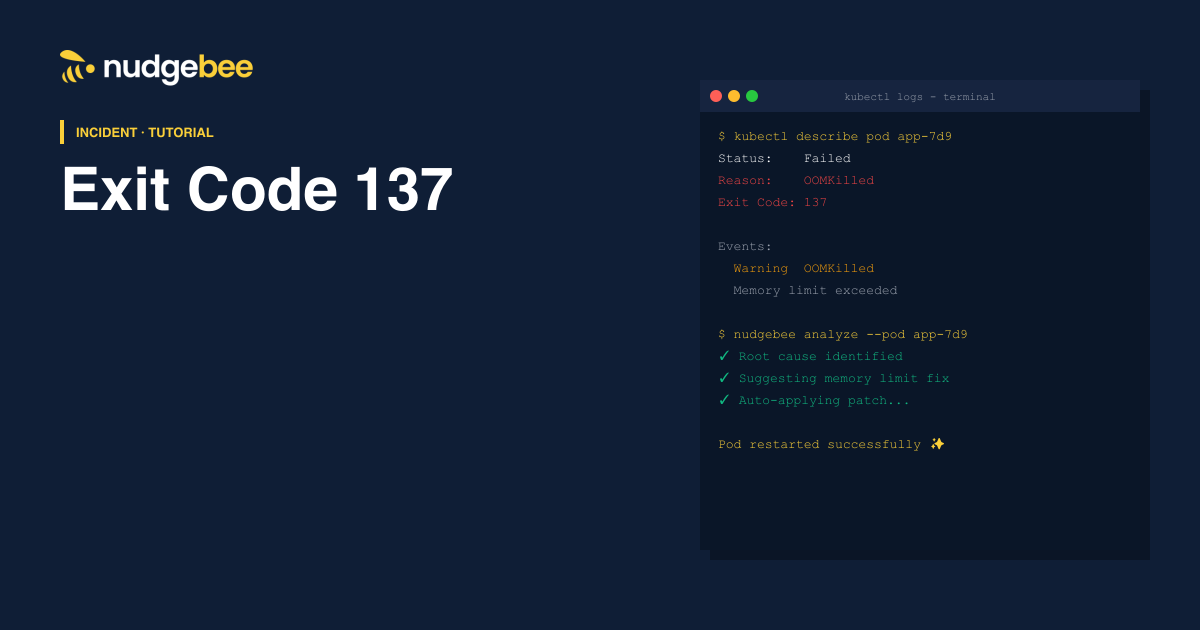
If you're seeing OOMKilled in your pod status, or Exit Code 137 in Kubernetes, your container was killed for running out of memory (also written as OOM killed).
👉 Simple meaning:
- Your container used more memory than allowed
- Kubernetes killed it to protect the node
👉 Quick fixes:
- Increase memory limits
- Fix memory leaks
- Use monitoring (Prometheus / Grafana)
- Add autoscaling (VPA)
What is OOMKilled?
OOMKilled is the status Kubernetes reports when the Linux kernel's OOM (out-of-memory) killer terminates a container's process for exceeding its memory limit. The container then exits with code 137, which is 128 plus signal 9 (SIGKILL), the same code Kubernetes uses whenever a process is forcibly killed.
What is Exit Code 137?
Exit Code 137 = SIGKILL (Killed process)
In Kubernetes, this almost always means:
👉 Your pod ran out of memory
👉 Kubernetes forcefully stopped it
In simple terms:
Exit code 137 = Your app used too much RAM → system killed it
OOMKilled vs Exit Code 137 vs Evicted
These three terms get used interchangeably, but they describe different failure paths, and telling them apart is the fastest way to know what you're actually looking at.
- OOMKilled: the container itself exceeded its own memory limit. The kernel's OOM killer inside that container's cgroup kills the process, and Kubernetes reports Reason: OOMKilled with exit code 137.
- Exit code 137: the exit code itself, not a cause. It means SIGKILL. OOMKilled is the most common reason a container exits with 137, but a container can also be force-killed by a manual kubectl delete --force, or by exceeding its termination grace period during a rolling update, so 137 alone doesn't prove memory was the problem.
- Evicted: a node-level decision, not a container-level one. When a node runs low on memory or disk, the kubelet proactively evicts entire pods to protect the node, before any single container's OOM killer would otherwise fire. Evicted pods show Status: Evicted with a reason like MemoryPressure, not OOMKilled.
In short: OOMKilled is one specific cause of exit code 137, and eviction is Kubernetes acting a layer higher, at the node, before any single container's OOM killer gets involved.
Fix OOM at the Source
Limits, leaks, or node pressure.
Why does Exit Code 137 happen in Kubernetes?
Here are the most common reasons:
1. Memory limit is too low
Your pod has a limit like:
resources:
  limits:
    memory: "512Mi"
👉 If your app needs more → it crashes
2. Memory leak in application
Your app keeps consuming memory:
- unclosed connections
- large caches
- inefficient loops
👉 Eventually → exceeds limit → killed
3. Node memory pressure
Even if your pod is fine:
👉 Node doesn’t have enough memory
👉 Kubernetes kills pods to survive
4. Heavy workloads
Examples:
- large queries
- batch jobs
- big datasets
👉 Temporary spike → pod killed
The 3 Types of OOM Kills
Most explanations stop at "your pod used too much memory," but that covers three genuinely different situations, and the fix is different for each.
1. Container hits its own limit
The most common case. The container's cgroup memory usage crosses the limits.memory value set on the pod, the kernel OOM killer inside that cgroup fires, and Kubernetes reports Reason: OOMKilled on that specific container. This is what most of this guide covers.
2. Node memory pressure (eviction)
The node itself is short on memory, often because too many pods are scheduled onto it relative to what it can actually provide. The kubelet detects the pressure and evicts pods to protect the node before it becomes unresponsive. This shows up as Evicted, not OOMKilled, and rightsizing pod requests across the node is usually the real fix, not just raising one pod's limit.
3. The invisible OOM kill
A process inside the container is killed by the OOM killer, but it's a child process rather than PID 1, so the container keeps running and Kubernetes never reports OOMKilled at all. This is common with apps that fork worker processes, such as Gunicorn or Node.js cluster setups. The container looks healthy from the outside while a worker silently restarts and requests fail intermittently, with kubectl describe pod showing nothing unusual. The fix is to check the kernel log directly: dmesg or journalctl -k on the node will show Killed process entries even when the pod status doesn't.
How to Diagnose OOMKilled Pods
Before changing anything, confirm what actually happened.
kubectl describe pod <pod-name>— check the State and Last State sections. Reason: OOMKilled with Exit Code: 137 confirms a container-level OOM kill specifically, not eviction or a crash from something else.kubectl get events --sort-by=.lastTimestamp -n <namespace>— shows recent events across the namespace, including Killing and Evicted events, useful once the pod has already been rescheduled or deleted.kubectl top pod <pod-name>— needs metrics-server; shows current memory usage against the pod's limit, useful for confirming a pod is trending toward its ceiling before it gets killed.kubectl describe node <node-name>— check Allocatable versus Requests under Non-terminated Pods, to see whether the real problem is node-level memory pressure rather than one pod's limit.- If none of the above shows OOMKilled but you suspect an invisible OOM kill, check
dmesgorjournalctl -kon the node directly for Killed process lines.
How to Fix OOMKilled and Exit Code 137 (Step-by-Step)
Increase Pod Memory Limits
Update your deployment:
Adjust your deployment YAML to allocate more memory.
resources:
  requests:
    memory: "512Mi"
  limits:
    memory: "1Gi"
Best for:
- stable apps needing more memory
Be careful:
- don’t over-allocate → node crash risk
2. Fix Memory Leaks (Important)
If memory keeps increasing:
👉 You need to fix code, not infra
Use tools:
- pprof
- heap dumps
- Prometheus metrics
Check:
- large objects
- open connections
- unnecessary caching
3. Use Vertical Pod Autoscaler (VPA)
Automatically adjusts memory
Best for:
- unpredictable workloads
4. Monitor Memory Usage
Don’t wait for crash.
Use:
kubectl top pods
Or:
- Prometheus
- Grafana
Set alerts when usage > 80%
Automatically adjusts pod resource requests and limits.
Let VPA Right-Size
Auto-tune requests and limits.
Pro Tip
Don’t only increase memory blindly
If you don’t fix root cause:
problem will come back
How to Prevent OOMKilled and Exit Code 137
Fixing one OOMKilled pod is a one-time task. Preventing the next one is a rightsizing problem.
- Set requests close to actual usage, not guesses. A limits.memory set far above requests.memory means the scheduler under-provisions the node for what the pod will really use, which is exactly the setup that produces node memory pressure.
- Rightsize on real data, not once at deployment time. Usage drifts as traffic and code change, so a limit that was correct at launch can become too tight months later.
- Run the Vertical Pod Autoscaler in recommendation mode first, before switching it to auto-apply, so you can see what it would change before it changes anything in production.
- Treat memory rightsizing as a cost problem too, not just a reliability one: over-provisioned limits waste cluster capacity the same way under-provisioned ones cause crashes. See our roundup of Kubernetes cost optimization tools for tools that handle this continuously rather than as a one-time exercise.
- Watch for the invisible OOM kill pattern specifically if you run apps with worker processes: a rightsizing pass that only looks at container-level OOMKilled events will miss it.
Troubleshooting Checklist
Before fixing, check:
- Pod events → kubectl describe pod
- Logs → kubectl logs
- Node usage
- Confirm OOMKilled status
Cut MTTR for Pod Crashes
Guided workflows, fast recovery.
Quick Fix Reference Table
| Fix | When to Use | Risk |
|---|---|---|
| Increase memory limits | Stable app, just under-provisioned | Node exhaustion |
| Optimize code | Memory leaks suspected | Slower to implement |
| VPA | Dynamic workloads | Overhead |
| Monitoring | Continuous issues | Setup effort |
How NudgeBee Helps
Exit Code 137 and OOMKilled errors are one of the most common reasons SRE and platform teams get paged. NudgeBee's AI-K8sOps agent reads the pod's events, the node's memory pressure, and the container's usage history together, so it flags the actual root cause, whether that's a limit set too low, a leak, node pressure, or an invisible OOM kill, and the specific memory setting to change, instead of leaving an engineer to run through describe, top and dmesg by hand. Its rightsizing recommendations also catch the pattern before it repeats, since a pod OOMKilled once under the same workload will get OOMKilled again unless the limit or the code changes.
See AI-K8sOps for how this works in practice, and how it shares rightsizing signal with the FinOps agent so a memory fix and a cost fix come from the same recommendation.
- Detect pods nearing OOMKilled before they crash.
- Recommend fixes automatically.
- Reduce MTTR with guided workflows.